

Leaf Wetness Data Processing: From Raw Sensor Signal to Accurate Classification
- Y. Osroosh, Ph.D.

- Nov 10, 2024
- 3 min read
Updated: Apr 28, 2025
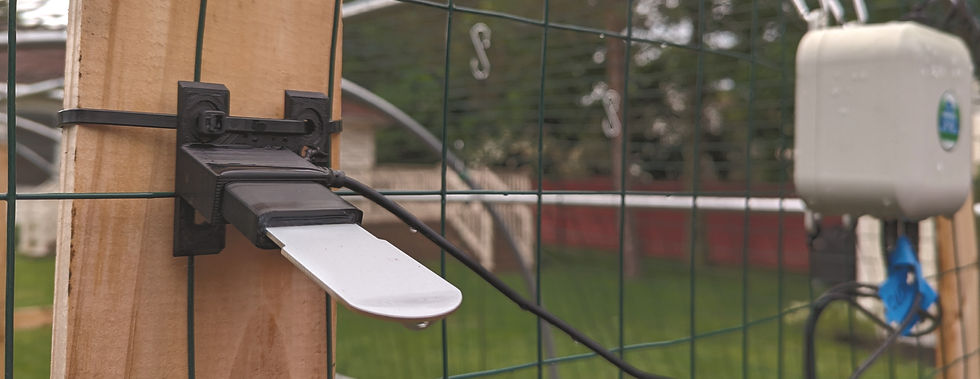
I've engineered a leaf wetness sensor that operates by detecting changes in the dielectric constant of its surface. This approach yields an analog output signal that continuously reflects the degree of wetness. Complementing this, a digital temperature output is integrated to account for ambient temperature fluctuations. The sensor's inherent high signal-to-noise ratio (SNR) ensures robust and precise measurements, even when faced with challenging environmental conditions such as fog or light dew.
The Challenge of Raw Sensor Data
Despite the sensor's capabilities, the raw analog signal is inherently susceptible to noise and temperature-induced variations. This susceptibility makes it challenging to directly and accurately correlate the initial sensor readings with specific leaf wetness events like rainfall or dew formation. Without careful processing, the resulting time-series data can be misleading, obscuring genuine moisture signals amidst background noise and thermal drift.
A Comprehensive Data Processing Pipeline
To overcome these inherent limitations of raw sensor data, I've developed a robust data processing pipeline encompassing several critical stages. This pipeline strategically employs temperature compensation to mitigate temperature-induced variations, noise reduction techniques to eliminate unwanted signal fluctuations, and baseline correction to establish a reliable reference point representing dry leaf conditions.
By systematically applying these techniques, the processed data provides a significantly clearer and more accurate representation of actual leaf wetness events, thereby facilitating more reliable identification and in-depth analysis.

Here's a detailed breakdown of the leaf wetness sensor data analysis pipeline:
1. Signal Pre-processing: This initial phase focuses on preparing the raw sensor data for subsequent analysis. Key steps include:
Analog-to-Digital Conversion (ADC): Converting the continuous analog signal from the sensor into a discrete digital format suitable for computational processing.
Temperature Compensation: Applying algorithms to remove the influence of temperature variations on the dielectric constant readings, ensuring that changes in the signal primarily reflect actual moisture levels.
Noise Reduction: Employing digital signal processing techniques (e.g., moving averages, Kalman filtering) to minimize random fluctuations and spurious signals, thereby enhancing the clarity of the underlying wetness information.
2. Signal Processing: This stage transforms the pre-processed data into a format optimized for machine learning algorithms and event classification. Essential steps include:
Baseline Calculation: Establishing a reference signal level that corresponds to dry leaf conditions. This baseline is crucial for accurately detecting and quantifying wetness events. It might involve analyzing periods of known dryness or employing statistical methods to determine a dynamic baseline.
Feature Extraction: Deriving relevant features from the processed time-series data that effectively capture the characteristics of different wetness events. These features could include the magnitude of signal change, the rate of change, the duration of wetness, and statistical measures like mean, variance, and skewness over specific time windows.
Normalization/Scaling: Standardizing the extracted features to a common range. This step is often crucial for the optimal performance of many machine learning algorithms, preventing features with larger values from disproportionately influencing the model.
3. Signal Classification: In this final stage, the processed and feature-engineered data is fed into a trained machine learning model. This model learns to classify the signal patterns into distinct categories of leaf wetness events, such as:
Rainfall (characterized by rapid and significant increases in wetness)
Dew (typically exhibiting gradual increases and sustained periods of moderate wetness)
Frost (potentially showing a distinct signal signature related to ice formation)
Fog/Mist (often resulting in prolonged periods of light to moderate wetness)
Model Development and Promising Results
Through rigorous data collection across diverse environmental conditions and meticulous analysis, I developed a piecewise linear model to effectively compensate for temperature-induced variations in the sensor readings. You can learn more about the effect of temperature on leaf wetness sensor readings in this article: "Why Most Leaf Wetness Sensors Fail."
Furthermore, I successfully trained a machine learning model to accurately classify leaf wetness events into the aforementioned categories: rainfall, dew, and frost. This model leverages key features derived from the leaf wetness sensor data, integrated with the corresponding sensor temperature and temporal information (time of day, day of year), to achieve an impressive classification accuracy of 94%.
While incorporating additional data sources such as soil moisture and temperature did further improve accuracy to 99%, my current focus remains on optimizing the model's performance using data solely from the leaf wetness sensor itself. This approach aims to create a more self-contained and readily deployable system.
I am excited to share more in-depth details about the specific algorithms, model architectures, and performance metrics in a forthcoming article. Stay tuned for a deeper dive into the intricacies of this leaf wetness classification system!


Comments