

QA Engineers: A Python GUI for Embedded Linux System Testing
- Y. Osroosh, Ph.D.

- Apr 20, 2024
- 13 min read
Updated: Apr 18, 2025

My recent task involved developing a software package, a test suite, for the End-of-Line (EoL) testing of an embedded Linux system (ELS). This ELS hardware comprised a single-board computer, a daughterboard, a wireless module, and other components, featuring input ports for external sensors. Initially, the plan was to utilize Python and bash scripts along with SSH to interact with the ELS. However, upon inquiring about the end users, I learned they would be engineers on the manufacturing floor – individuals who are not necessarily software developers or engineers.
As someone who frequently develops on or for embedded Linux, I empathize with those who find Linux unappealing or even intimidating. Linux can indeed seem like a peculiar world, perhaps stemming from the Linux kernel's design reflecting the vision of its creator, Linus Torvalds. To enhance the test suite's user-friendliness, I decided to go beyond simple SSH interactions and incorporate a graphical user interface (GUI). Furthermore, I conceived a modular architecture for the test suite, aiming for potential reconfiguration and reuse (with minimal modifications) for testing similar embedded systems.
In this article, I will provide a high-level overview of the test suite's architecture, features, and graphical user interface. I will briefly explain how the test suite can be configured and employed for the EoL testing of an embedded system. The details of how functional tests are defined and executed will be reserved for a subsequent article.
What Is End of Line (EoL) Testing?
Given their inherent complexities, thorough testing of manufactured embedded systems is paramount. End-of-Line (EoL) testing serves to verify that all components within the device under test (DUT), which in this case is the embedded system, including its ports, board interfaces, and modules, operate as designed. EoL testing is conducted as a final verification step, supplementing earlier testing phases such as burn-in and the general testing of individual hardware components before their integration into new units. Readers interested in a more comprehensive industry definition are encouraged to consult relevant literature, including the chapter "End-of-Line – EoL Testing" by Klippel (2011).
Embedded Linux System: Device Under Test (DUT)
While I cannot disclose the specifics of the actual embedded Linux system targeted by the test suite, I will adapt the description as if it were developed to test the embedded Linux system illustrated in Figure 1, which was created as part of a research project. This ELS/DUT is equipped with a computer vision middleware and is primarily utilized in agriculture for applications such as plant high-throughput phenotyping and precision agriculture. Its core hardware consists of a single-board computer, a microcontroller-based daughterboard, a touchscreen, imaging sensors, an ultrasonic range finder, a light sensor, a wireless module (available on the latest model only), and various other components. Additionally, it accommodates inputs from certain peripherals, such as an external microclimate unit connected via a serial port (SDI-12).

The embedded Linux system that was the initial target of the test suite was somewhat simpler, comprising a single-board computer, a daughterboard, a wireless module, and a few ports (audio, RJ-45, USB, RS4-85). Beyond its ability to be self-powered via lithium-ion batteries, this ELS features an Ethernet port, which serves a dual purpose: delivering both power (through a PoE injector) and a network connection to the unit. Figure 2 illustrates the physical connections between the ELS, the injector, a network switch, and a local computer.

Using Emulated Sensors
When it comes to testing sensor ports, one might consider using actual physical sensors as part of the test setup. However, the potential for sensor malfunctions, inaccuracies, and other issues could introduce extraneous variables, thereby complicating the testing process. In my view, it is preferable, whenever and wherever feasible, to substitute physical sensors with emulated ones. Sensor emulation can be implemented in a highly cost-effective manner using various microcontroller boards or even single-board computers if greater processing power is required.
Architecture of Test-Suite
Desired Features
The primary intended users of this test suite were members of the manufacturing team who lacked a background in software engineering or development and possessed minimal familiarity with the Linux operating system. Their requirement was to utilize the test suite to confirm that assembled units and their constituent components were fully operational before shipment. With this in mind, I determined that my test suite should incorporate the following features:
Feature a graphical user interface (GUI) for interactive use.
Accept user input, such as initials and serial numbers.
Execute automated tests.
Employ a modular design, facilitating the rapid creation of new tests or the modification of existing ones.
Allow for the sequential execution of tests.
Generate and display test results in an easily understandable format (e.g., passed, failed, aborted).
Format and log test results both locally and/or in an online database.
Possess the capability to be integrated into other solutions.
Support the simultaneous testing of multiple DUTs.
Client-Server Architecture: JSON-RPC over HTTP
The initial iteration of the test suite I developed leveraged the APIs exposed by the ELS middleware. However, this approach presented certain limitations concerning the scope of tests and access to the underlying hardware. To gain complete control, I opted to structure the test suite into distinct Client and Server software packages, thereby making it independent of the middleware:
Client: A desktop application featuring a graphical user interface (GUI) that the user operates on their local computer.
Server: A headless application designed to run directly on the DUT.
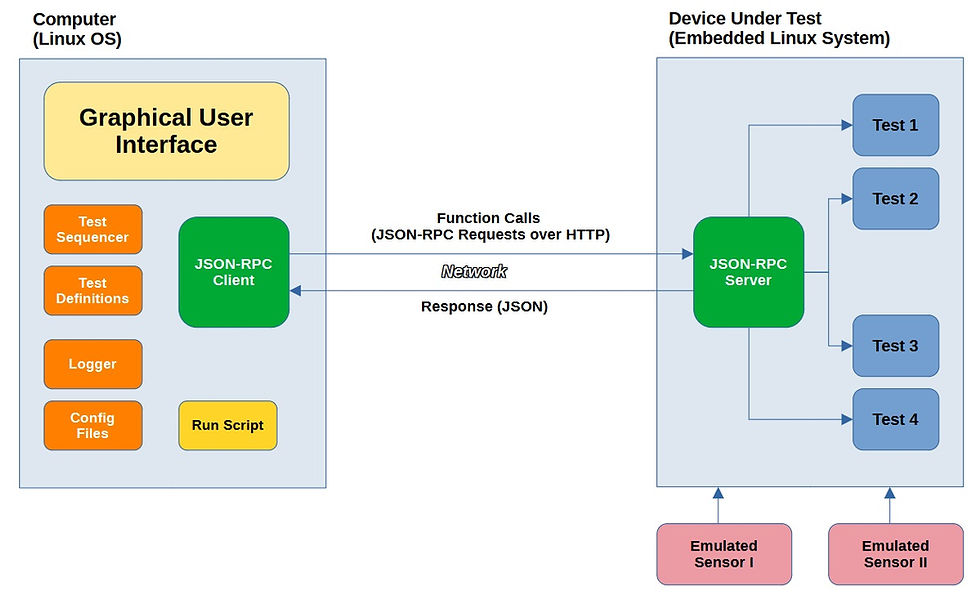
In this architecture, the Client dispatches JSON-RPC requests (essentially, function calls) over HTTP to the Server. Upon receiving a request, the Server executes the corresponding action, which typically involves performing a specific test, and then sends back a response to the Client. Each JSON-RPC request message includes a method (representing the test name) and may optionally contain parameters (params) necessary for conducting the particular test. For instance, the Client sending a "testAudio" request prompts the Server to play a sound on the DUT. Similarly, a "setOsVolume" request, as illustrated in Figure 3, instructs the Server to set the DUT's operating system volume to its maximum value ("value": 100).

One notable advantage of this client-server architecture is the ability to utilize Postman flows to effectively verify the HTTP requests, including their bodies which are formatted in JSON-RPC. The overall architecture of the test suite is visually represented in Figure 4.
In situations where the ELS operating system might monopolize local resources, it becomes necessary to efficiently stop the middleware or even flash the ELS with a different operating system to properly accommodate the tests. An alternative strategy involves writing a compatible OS image onto a flash drive and booting the system from it. However, this approach might not be feasible for an ELS fresh off the manufacturing line, as the single-board computer is likely to be flashed with an OS lacking the requisite board support package.
Tools
To develop the test suite, I utilized the following tools, standards, and communication protocols, among others:
Python and Bash
JSON-RPC over HTTP (for invoking tests on the DUT)
SPI (spidev), UART, RS485, RS232, SLIP encapsulation, etc.
Having prior experience developing GUIs using Qt and C++ (as seen in this example), I decided to leverage the familiar PyQt (the Python binding for Qt) for GUI development. Irrespective of the programming language, I consider the Qt framework a robust choice, a conclusion I've reached after years of GUI development using MS Visual Studio.
I developed and tested both the Client and Server packages on Linux (Ubuntu 22.04.2 LTS).
I made a concerted effort to make the Client package operating system agnostic. Nevertheless, significant additional work would be required to ensure its seamless operation on other operating systems such as Windows or different Linux versions and distributions.
Software Packages
Client Software Package
The Client software package is structured into the following parts and each part is comprised of at least one Python module:
Run script
GUI
Test sequencer
Test definitions
Logger
Configuration files
Run script
I added a bash script (run.sh) that is used to start the GUI after carrying out some system pre-checks to make sure all dependencies and required libraries are installed. If the script determines that any of the required packages are not installed, it will print a message with tips on how to install missing packages. This process can be automated, but I left it there.
Graphical user interface
The GUI is at the heart of the test-suite and contains classes, functions, variables and constants that define the application appearance and how it interacts with the user. The GUI runs in its own thread and other major tasks such as DUT tests run in separate threads. For multi-threading I relied on Qthread, pyqtSignal, Qmutex, etc.
Test sequencer
The test sequencer is the main module for sequencing EoL tests. I did my best to keep this module as simple as possible, in case another developer or an advanced user needed to move things around. The tests are categorized into hardware, function and manual groups for convenience.
Test definitions
This module contains all the functions and classes that define and implement various EoL test groups. Based on the design of the ELS and requirements of the project, I defined a variety of methods called functional tests to test ELS hardware components (and some software aspects). I also came up with some criteria (not easy) to be able to make reasonable Pass/Fail decisions. The tests range from fully automatic to manual with instructions provided by the application (Client) in the form of popup messages and console prints. The result of a test is provided in the form of Pass/Fail classification. If an automatic test fails, the reason is provided and logged. If a manual or semi-automated test fails, the user is asked to provide an explanation, which is recorded as well.
Logger
The logger module contains classes, methods and functions used to store tests results in JSON format. It also prints error and info messages to the console.
Configuration files
Configuration files store parameter for configuring EoL tests. Initially, there is going to be only a default configuration file. The user can modify the default config file and save under a new name (any name except the name taken by the default config file).
Server Software Package
The Client software package is structured into the following parts and each part is comprised of at least one Python module:
Run script
JSON-RPC Server
Manager
Test definitions
Libraries
Run script
Similar to the Client software package, I added a bash script (run.sh) that is used to start the Server after carrying out some system pre-checks to make sure all dependencies and required libraries are installed. If the script determines that any of the required packages are not installed, it will print a message with tips on how to install missing packages. Ideally, the packages are installed only once and the modified OS image is flashed into DUTs. The Server scripts; however, can be easily updated by the Client.
JSON-RPC Server
This module implements contains required functions, classes and methods to implement a JSON-RPC server on DUT.
Manager
Similar to the Client, I implemented muti-threading on the Server side. As the name implies, the manager module manages the data that is shared among various threads. It also creates some shared objects accessed and used by other modules.
Test definitions
This module contains all the functions and classes that define and implement various DUT test groups. It also prepares and sends a response to the Client (in JSON format) after a test is carried out.
Libraries
To be able to communicate with and test some of the hardware components (e.g. wireless module), I created and added a number of Python libraries (example). I formatted one of the libraries into a class that could be run as a QThread to work in the background.
Graphical User Interface (GUI)
My favorite way to design GUI is tabular, so I organized the GUI into two tabs: Console and Configurations, and added a menu bar. The GUI components are explained below.
Console Tab
The Console tab (Fig. 5) includes buttons (on the left side) and two console windows for prints with Client and Server as the source, respectively. The application prints information, error messages, instructions, etc to the console. The application also uses popup messages and dialog boxes for interactions with the user.

The buttons in the Console tab have the following functionalities:
Start. starts a configured testing sequence.
Stop. stops running test sequence. Clicking this button will not terminate running threads and the user needs to wait until an ongoing process ends.
Find MAC. finds the MAC address for the connected (wired) DUT.
Find IP. finds the IP addresses for localhost and connected (wired) DUT(s).
Find Device. finds the port name for any connected adapter (e.g. RS232-to-USB) or TTY device that exposes u-boot console.
Configurations Tab
The Configurations tab (Fig. 6) includes most of the options and required inputs for configuring DUT functional tests and running included utilities. As it can be seen, the configurations are categorized into different group boxes:
Config File
Group Configs
Test Configurations
Parameters: Serial ports
Parameters: Thermal Thresholds
User Inputs

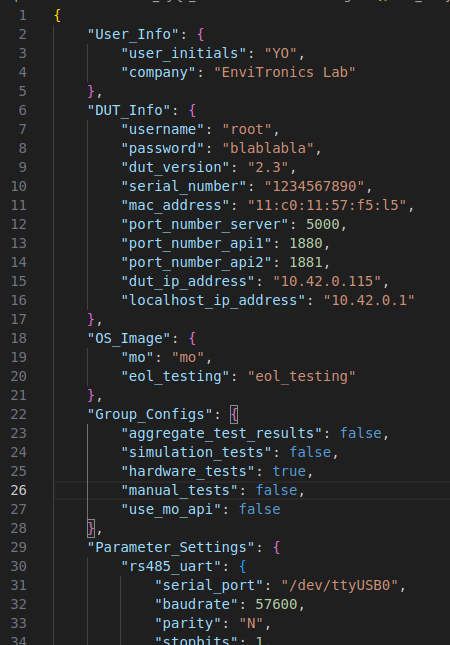
As mentioned before, the application comes with a default config file (JSON format; Fig. 7). The user can change default configurations and then save them into a new config file (by clicking the ‘Save’ button) under a new name. The next time the application starts, it will automatically load configurations from the file created by the user. There can be multiple config files and use each with a different DUT. The ‘Default’ button loads the default configurations.
EoL tests are categorized into the following groups for convenience and there is an option to Aggregate Test Results at the end of a test sequence:
Simulation tests
Hardware tests
Manual tests
An entire test group can be disabled/enabled by unchecking/checking the related box. If the ‘Aggregate Test Results’ box is checked, the application (Client) will aggregate all the test results into a single JSON file. If there are multiple test result files for any given test, they will all be included in the aggregated file. ‘Simulation tests’ only work when emulated sensors are connected to DUT.
In the Test Configurations section, individual tests under test groups described above can be enabled/disabled. If the ‘Logged’ box is checked, the application will log test results for that specific test, otherwise it will only run the test (without logging).
The Parameters: Serial Ports section holds serial port settings for the rs485_com test using a RS485-to-USB adapter, and u-boot console. The latter is automated and does not need to be configured by the user. The Parameters: Thermal Thresholds holds settings for the thermal_check manual test, which is carried out to check the body temperature of the ELS when running at full power. The minimum and maximum temperatures need to be set once.
The application requires the user to enter the following information to start with DUT functional testing:
Initials: user initials
Co.: company name or location
Version: DUT version
SN: DUT serial number
MAC: DUT MAC address
IP (Localhost): local computer IP address
IP (DUT): connected DUT IP address
If any of the fields are left empty, the application will prompt the user to enter missing information. Some of the fields are automatically filled.
Menubar
The menubar includes File, Actions, Tests, Tools, and Help menus. The Tools menu includes several utilities that allow the user to prepare DUT for functional testing. Items in the Tools menu are as the following:
Create Image Chunks. Used to generate OS Image chunks out of an OS Image which has a large size and cannot be directly flashed into DUT.
Flash OS Image. Used to flash OS image (chunks) that contain Server into DUT.
Flash Daughterboard. Used to flash the DUT daughterboard with a new firmware.
Update wireless Module Firmware. Firmware is provided by the manufacturer.
Update Server. Used to transfer Server files from a host computer to DUT.
Functional Testing
Required Steps
To run functional tests on DUTs that come out of the manufacturing line, some preparations are needed. For example, manufactured DUTs need to be flashed with a modified version of the stock OS image that has all the necessary packages installed. In my case, I needed to enable spidev, so I created a device tree overlay and applied in U-Boot. In addition, the daughterboard and some of the modules might need software/firmware updates. The required steps to prepare DUTs for functional testing using the test-suite are as the following:
Create a configuration file for connected DUT
Create OS image chunks
Flash OS Image prepared specifically for EoL testing
Flash daughterboard
Update wireless module firmware
Transfer Server software package to DUT
Determine MAC address for connected DUT and update the configuration file
Test Sequencing
The tests are currently sequenced as the following and will be executed one after another:
test_1
test_2
test_3
...
To exclude any of the above tests, changing the configurations in the Configurations tab will suffice. To start a functional test sequence, the following steps are taken:
In the Configurations tab, functional tests are configured and saved.
In the Console tab, the Start button is clicked to start the test sequence. Prompts, info and console messages will guide the user through the rest of the process.
A popup message at the end will provide a summary of the test results.
The test sequence can be stopped at anytime by clicking the Stop button in the Console tab. The application might need to finish active thread(s)/test before aborting the test sequence. No test summary is generated at the end should one decide to abort the test sequence.
Run Individual Functional Tests
As an alternative to executing functional tests in a sequence automatically, one may run individual tests as needed. The following steps are taken to run an individual test:
Prepare and connect appropriate hardware (e.g. USB to RS-232 adapter) for the test.
Find the test name in the list of tests under the Tests menu and click.
Wait for prompts and messages that will guide through the process.
Accessing Test Results and Logs
Location of Test Results
By default, the test results and process log files are stored locally and can be found under ~/test-results (Fig. 8). The directory is structured in the following format:
~/test-results/<date>/<serial_number>/<test_name>/<UUID>.json~/test-results/<date>/<serial_number>/<logs_client>/<UUID>.log~/test-results/<date>/<serial_number>/<logs _client>/<UUID>.log
Date is formatted as yyyy-mm-dd (year, month, day). The test_name refers to the actual hardware, software or function test (e.g. IMU_check). The logs_client and logs_server directories contain process log files for the Client (local computer) and Server (DUT) sides, respectively. Each JSON file has a unique name (UUID).
Contents of Logged data (JSON files)
JSON data files containing the test results are structured as shown (Fig. 9) and explained below. The JSON data files are designed to facilitate automatic extraction of information, data aggregation and uploading to an online database (if needed).

general
This section contains UUID, test start (start_time) and end (end_time) times, user initials (user_initials), company/location name (company), DUT version (dut_version), DUT serial number (dut_serial_number) and DUT MAC address (dut_mac_address).
test_results
This section holds a variety of information on a given functional test including its name, test result (pass_fail), and error message (if any). Should a test fail, the message field (message) will provide a short explanation (auto or user input) of what went wrong, which could be used later on for identifying the root cause of the issue. The “name” field matches the name of the directory where it stores test result JSON file for specific test.
Aggregation of Test Results
If the user checks the ‘Aggregate Test Results’ box in the Configurations tab or clicks ‘Aggregate Test Results’ from the Tests menu, the application will automatically read all the test results for specified date and aggregate into a single file (example: ~/test-results/2021-07-11/1234567890/aggregated_results).
The user can pick a date using the date picker in the menubar. If there are more than one test result files for a given test, the application will include all in the aggregated test results. The structure of an aggregated file (Fig. 11) in terms of fields is very similar to an individual test result file. The general field does not include start and end times, because these fields are already included in the result for individual tests.
Process Log Files
The application generates and stores separate log files for all activities happening on both the Server and Client sides. These directories are named logs_client and logs_server and can be found in the same location as the test result directories (~/test-results/<date>/<serial_number>/). Log files are named using UUID and have log as extension. Log file includes all test steps, errors, etc to help with debugging the process should it be unsuccessful.
References
Klippel, W., 2011. End-of-Line – EoL Testing, In Assembly Line - Theory and Practice. Edited by Grzechca, W., IntechOpen. DOI: 10.5772/21037 (URL)


Comments